
How to Read Dyno Charts Properly
Power curve, torque curve, correction standard, wheel power: how to read a dyno chart, which details belong on it and how to spot massaged numbers.
October 25, 2026 by Leo Efimow
At first glance a dyno chart looks unambiguous: two curves, a peak figure, done. In fact such a sheet contains much more, and some of it tends to get swept under the carpet. If you know what to look for, you can tell a clean measurement from a massaged one. Here we explain how a dyno measures, how to read the curves and which details belong on every serious chart.
How a chassis dyno measures
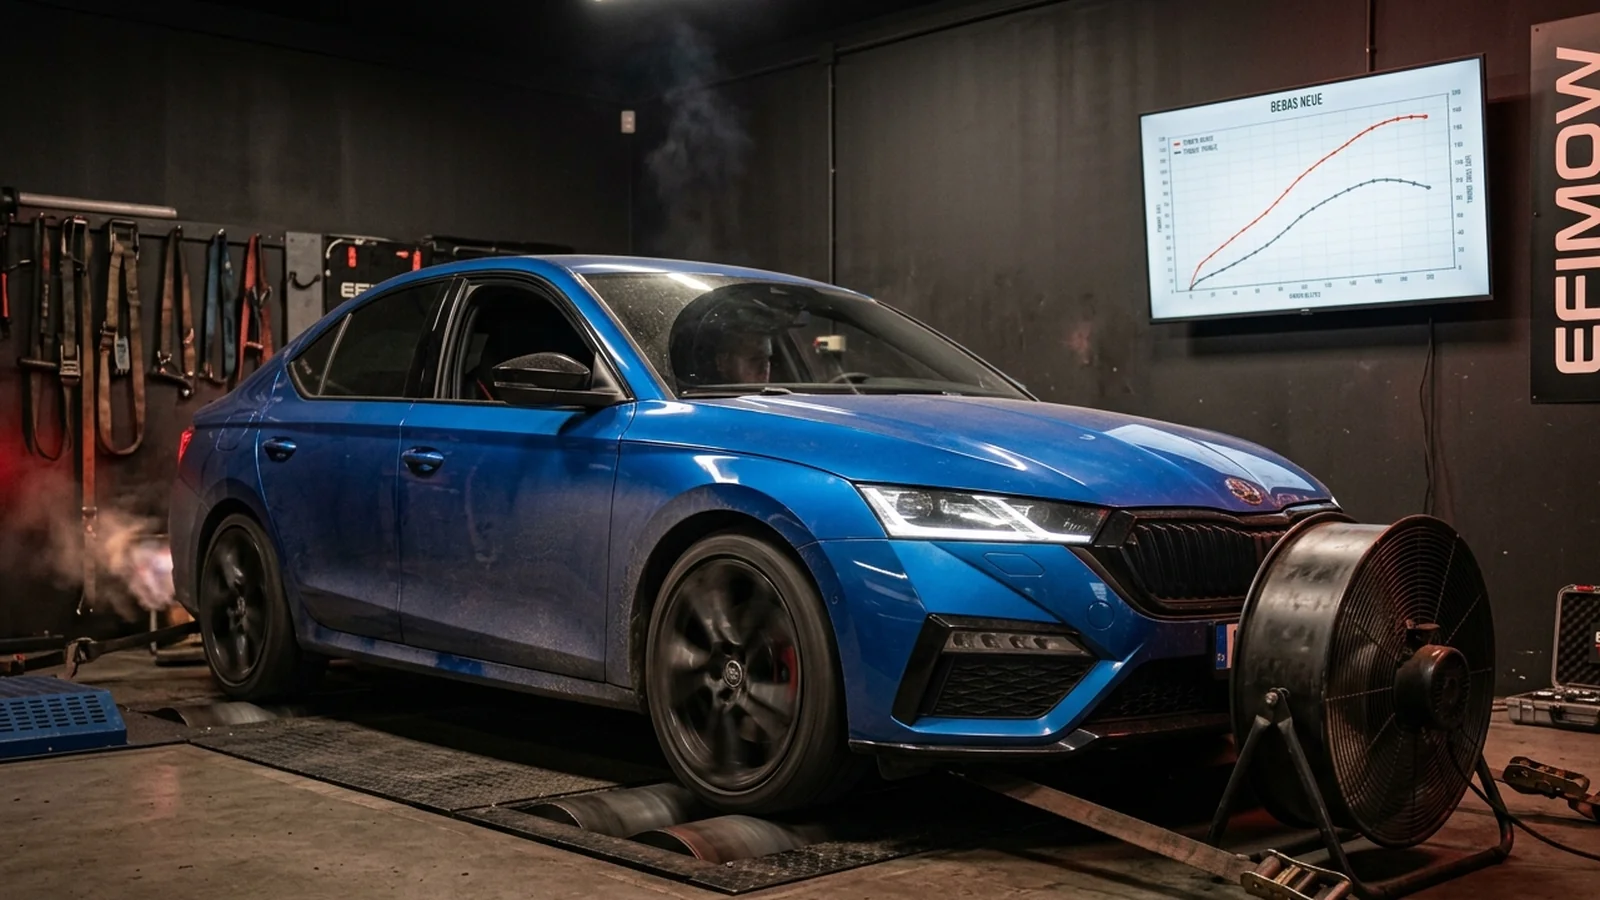
Most dynos for cars are roller dynos. The car stands with its driven wheels on rollers and accelerates them. What is measured is how much force arrives at the rollers. That gives the wheel power. There are pure inertia dynos, where a heavy roller is accelerated, and dynos with an eddy-current brake that apply a load and also allow steady-state measuring points.
There are also hub dynos, where the wheels are removed and the measuring units are bolted directly to the hubs. They avoid tyre slip and are very repeatable, but less common.
Wheel power and engine power
The manufacturer's figure in your registration document is engine power, measured at the crankshaft on an engine dyno. On a roller dyno only wheel power arrives. In between are losses in gearbox, driveshafts, differential and tyres.
Many dynos therefore calculate back to engine power. After the run, the clutch is disengaged and the car coasts down on the rollers. From this coast-down the dyno determines the loss power and adds it to the wheel power. The result is a calculated engine power. How accurate it is depends on the dyno, the vehicle and the operator. All-wheel drive and automatic gearboxes make the calculation harder.
Important for you: if a chart only shows "power", ask whether it is wheel or engine power.
The correction standard
An engine produces more power in cold, dry air at high air pressure than in hot, humid weather in the mountains. To make measurements comparable, they are converted to standard conditions. There are various standards for this, such as DIN 70020, EEC 80/1269, ISO 1585 or SAE J1349. They differ in their reference values for temperature, air pressure and humidity, and therefore in the result.
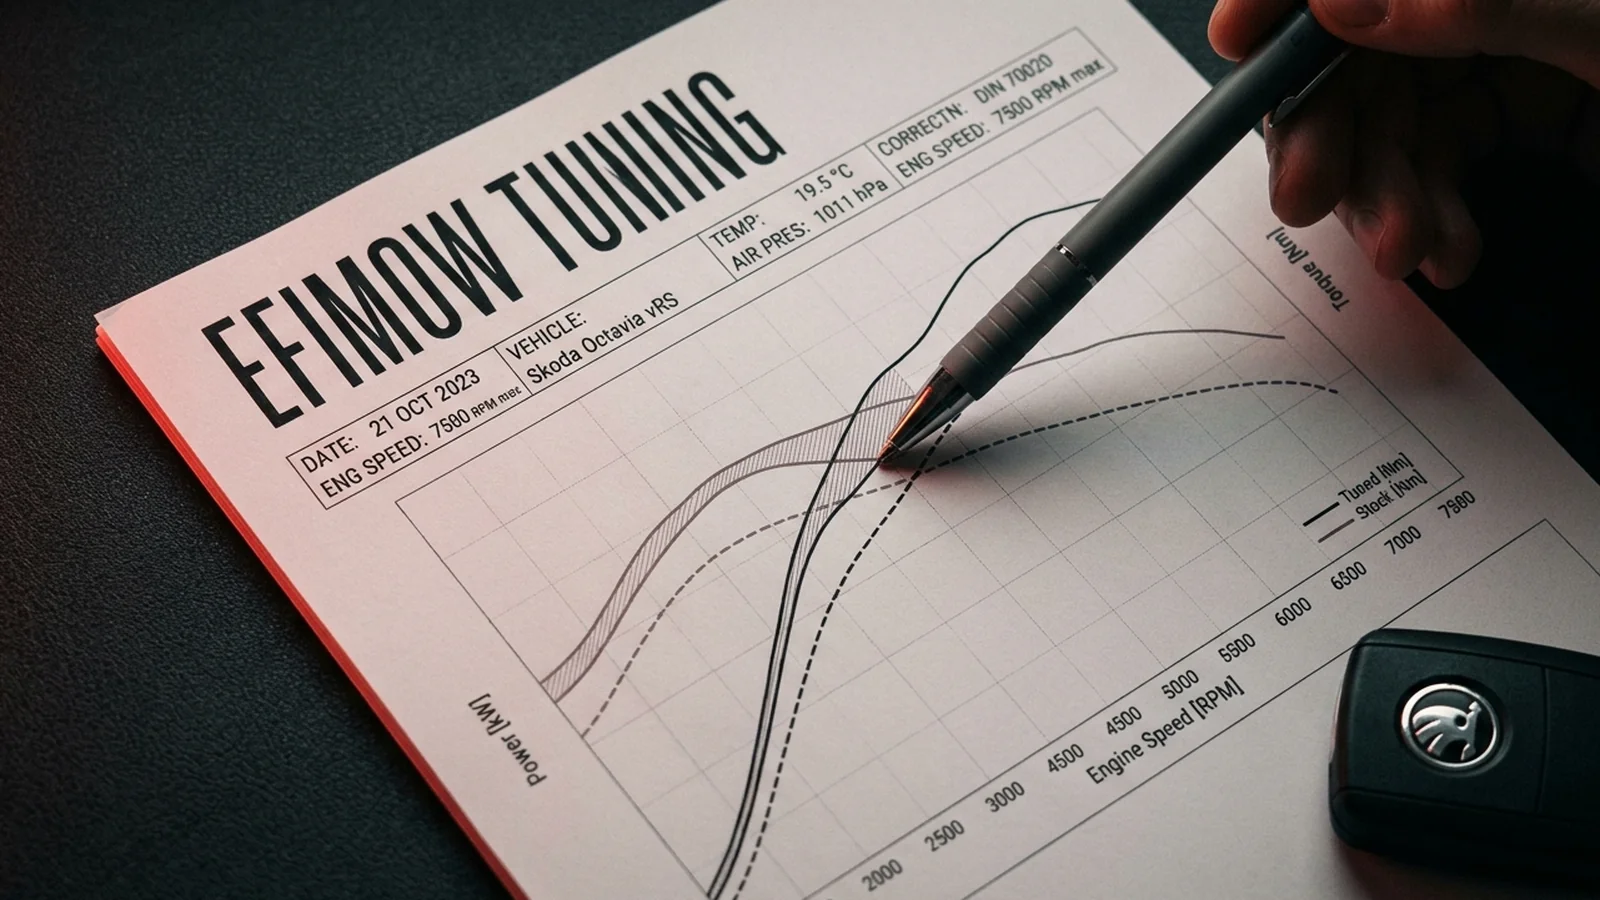
A serious chart therefore states the standard used and the ambient conditions during the measurement: intake air temperature, air pressure, often humidity too. Without these details the chart is hardly comparable.
Reading the curves
A typical chart shows two curves over engine speed: power and torque. The two are firmly linked. Power in kW equals torque in Nm times engine speed in rpm, divided by 9,549. High power at high revs therefore does not need huge torque; high power at low revs does.
What to look at:
- The curve, not just the peak: a curve that rises early and stays high feels better in everyday driving than one with a high, narrow peak.
- The area under the curve: when comparing stock with tuned, the area between the two curves says more about the noticeable gain than the difference in peak values.
- Dips and spikes: a sudden dip can indicate knock control, boost fluctuation or slip.
- Torque plateau on turbos: many turbo engines show a flat plateau because torque is deliberately limited, for example to protect gearbox and clutch. That is not a fault.
Comparing stock and tuned fairly
A before-and-after comparison is only meaningful if both measurements were made under comparable conditions:
| Criterion | Why it matters |
|---|---|
| same dyno | different dynos measure differently |
| same correction standard | otherwise you compare apples and oranges |
| similar temperatures | heat in the engine bay costs power |
| same gear | gear choice affects loss calculation and measurement |
| same fuel | octane rating matters on petrol engines |
| several runs | a single run can be an outlier |
An engine that is hot after several runs can produce slightly less than in the first run due to heat soak. Serious measurements take this into account with cool-down breaks.
Warning signs of massaged charts
- No correction standard and no ambient data given.
- Only peak values, no complete curves.
- Before and after on different dynos or on different days with very different weather.
- Maximum smoothing: heavy curve smoothing can hide dips.
- Unrealistic gains on naturally aspirated engines: typical Stage 1 guide values there are often only 3–8 %.
What a chart does not show
A power chart says nothing about durability, exhaust temperatures, lambda values or everyday behaviour. For that you also need a data log with boost, rail pressure, ignition timing and temperatures. A good tune shows not only in the peak figure but in all values staying within the safe range.
What to take away
If you are looking at a tune and get a chart, ask about wheel or engine power, correction standard, ambient conditions and whether before and after were measured on the same dyno. Typical guide values for your vehicle, depending on engine and ECU family, are shown in the configurator. Legally: a change in power voids the type approval unless it is inspected and registered. Our software functions are intended exclusively for motorsport; more in the motorsport notice.
Conclusion
A dyno chart is only as good as the details that come with it. Wheel power and engine power are not the same, the correction standard changes the result, and a fair comparison needs equal conditions. Look at the curve and the area under it, not just the peak. More on the dyno in the glossary under dyno.